
ALTERNATIVE TABLE: Fat and Scientific Shenanigans
By KAREN GAY
Cape Charles Wave Columnist
March 30, 2015
In my article of last week, I featured the Weston A. Price Foundation (WAPF) and described how their recommended traditional diet helped me lose 50 pounds over nine months by changing my fat intake to greater than 30 percent of calories coming mostly from saturated and monosaturated fats.
 As I lost my food cravings I began to do research on fat and its impact on one’s body. How could it be that for over 40 years the U.S. Department of Agriculture (USDA) was a strong proponent of low fat diets?
In 1968, after seeing an image of a child who had died of starvation in the CBS documentary, Hunger in America, George McGovern became the chair of the “Select Committee on Nutrition and Human Needs” with the goal of wiping out hunger and malnutrition in the United States. In 1977 the Select Committee published the “Dietary Goals for the United States” after hearing Dr. Ancel Keys and other supporting researchers speak about the link between saturated fat and cholesterol consumption.
From 1972 to 1973 and concurrent with the Select Committee, the American Heart Association, American Medical Association, and the National Academy of Science developed the following recommendations:
- Americans’ cholesterol is too high;
- We should measure our cholesterol in medical examinations;
- People considered as “at risk” should receive appropriate dietary advice;
- At risk Americans should reduce their intake of saturated fat by substituting polyunsaturated vegetable oils;
- Modified and ordinary foods (to support the ingestion of vegetable oils) should be available in the marketplace; and
- More studies should be performed to determine if lowering cholesterol can reduce chronic heart disease.
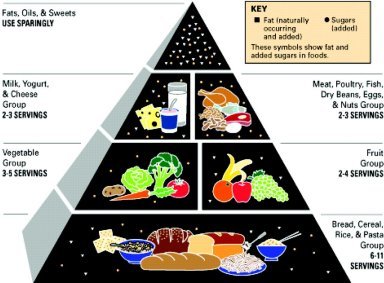 The piling on the bandwagon by these organizations led to the 1992 USDA Food Pyramid that most of us remember so well.
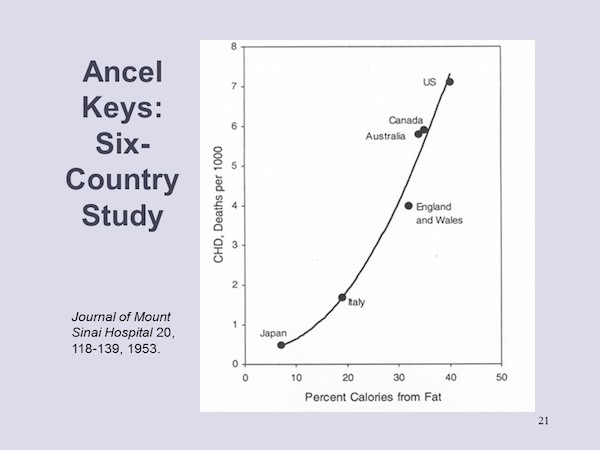
So how did all of these organizations arrive at these conclusions? I believe it was the work of Ancel Keys in the 1950s that started the idea that saturated fat led to the increase in heart disease. He noticed that death from heart disease dropped in areas where food rationing had been in place due to WWII and increased in industrialized areas of the world. Keys created graphs using food intake data and mortality statistics from the late 1940s using six countries: Japan, Italy, England, Australia, Canada, and the USA. The data appeared to show a correlation between the ingestion of fat and the increase in heart disease. We now call this the Diet-Heart Hypothesis which puts forward the idea that saturated fat causes cardiovascular disease (CVD) by raising blood cholesterol. He presented a graph at the 1955 World Health Organization conference that mapped fat intake to each country’s rate of death from heart disease.
CONTINUED FROM FIRST PAGE
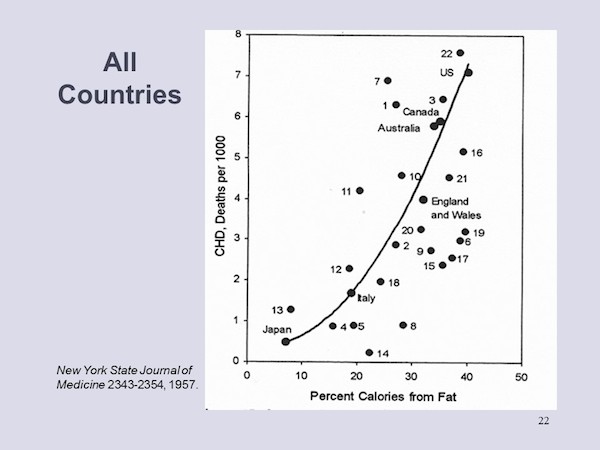
This first attempt to tie saturated fat to heart disease was met with skepticism especially by Sir George Pickering, a physician and college head at Oxford, Berkeley statistician Jacob Yerushalmy, and New York State Commissioner of Health, Herman Hilleboe. The dissenting scientists ridiculed Keys because he had picked the data from only six countries when the data with all 22 countries is shown below. They rightly questioned where he had gotten the line arbitrarily drawn in the middle of the data points.
Having learned from his disaster with the Six Country Study, Keys wrote the book Seven Countries: A Multivariate Analysis of Death and Coronary Disease. This time his data resonated with more people and the vegetable oil and food processing industries worked to gain support.
Another study beginning in 1948 was The Framingham Study which aimed to “Identify the common factors or characteristics that contribute to CVD by following its development over a long period of time in a large group of participants who had not yet developed overt symptoms of CVD or suffered a heart attack or stroke.” There were 5,209 men and women between the ages of 30 and 62 signed up and it has continued to the present and now even second and third generation children of the original group.
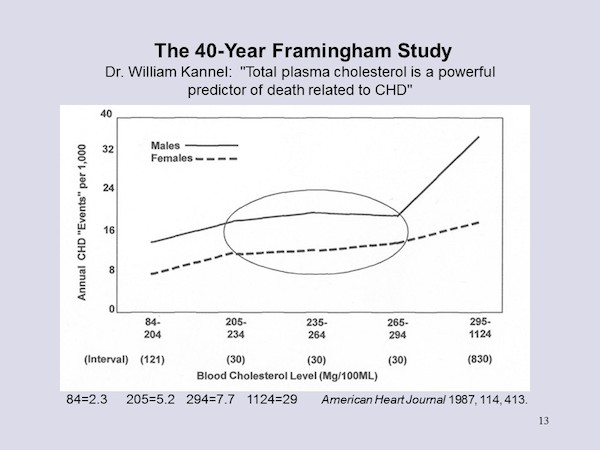
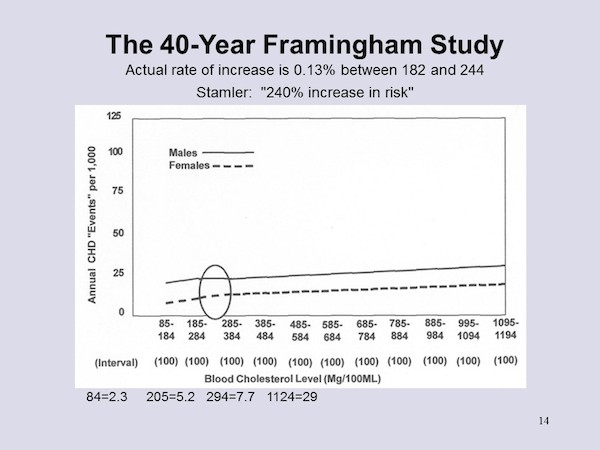
Over time there have been releases of findings. Initially, their findings supported the Diet-Heart Hypothesis. Here’s one chart released in 1987 in the well-known American Heart Journal. As shown at the top of the chart, Dr. William Kannel stated that “Total plasma cholesterol is a powerful predictor of death related to CHD. CHD is coronary heart disease. From the chart it appears that if cholesterol is above 265 then one is more at risk for CHD, especially if you’re a man. But wait a moment! Look at the intervals shown on the graph. The first is a spread of 121 points, followed by spreads of 30, and then lastly 830. Shouldn’t the intervals be equal?
Shown below is the same chart (drawn by Dr. Mary Enig) with even intervals and you can see there is no huge increase at a cholesterol level above 265 despite the pronouncement of Dr. William Kannel. As a matter of fact, according to this chart, the risk of a cholesterol level of 265 is only slightly less than of 385. It was this sort of study that led the American Heart Association, American Medical Association, the National Academy of Science, and the USDA to discourage the intake of saturated fat and the beginning of the revolving door between the FDA, USDA, and the pharmaceutical and food industry.
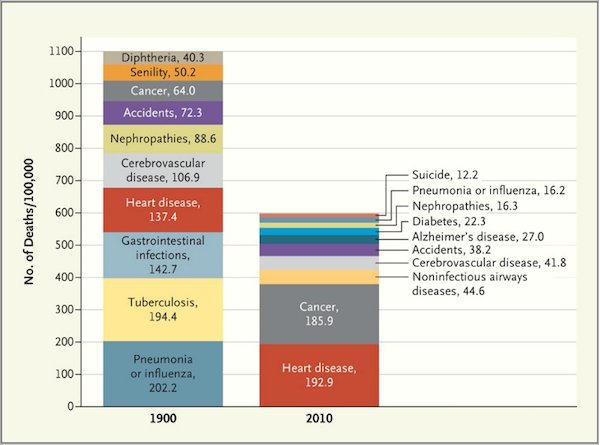
Oddly enough, if we travel back to the turn of the 20th century, we find that heart disease accounted for less than 10% of deaths. You can see in this chart published in The New England Journal of Medicine that I discovered in the Business Insider from June 24, 2012, shows that the U.S. death profile in 2010 is very different. In 1900, the death rate from heart disease is 137.4 per 100,000 people. In 2010 it is 192.9 per 100,000 people. According to the Centers for Disease Control and Prevention (CDC) data, the heart disease rate is coming down, even though it is still way too high.
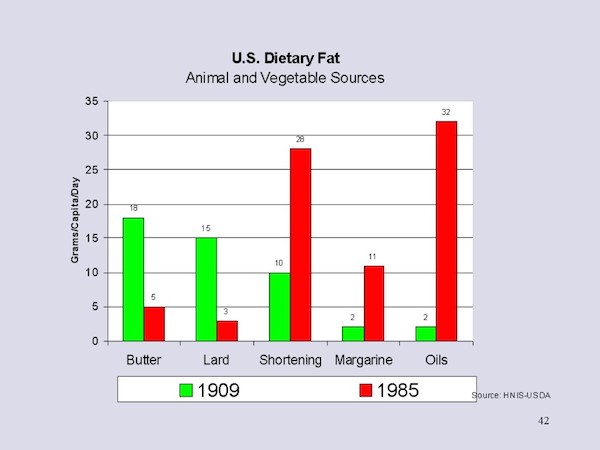
So if we suppose that it’s not saturated fat that causes heart disease, what could it be? Could one cause possibly be the rise in industrial oils? Or perhaps the increase in sugar usage? Or even some factor that all these studies have not identified? The chart below shows how the use of saturated fats has decreased according to the USDA recommendations. In 1909 shortening was a mixture of lard and coconut oil. Today shortening is partially hydrogenated vegetable oil.
Of course, the real question is that since Americans did as their Government and trusted medical organizations advised, why is the heart disease rate so much higher now than in 1900?
I’ve reviewed my sources, many of which are listed in References at the bottom of this article. One of the things I’ve come to appreciate is that these studies are created by scientists with all of the same conflicts, desires, and weaknesses that all of us have. They work in a very tough, competitive field where they struggle to find funding to pursue their research. I read an article that said that it is important to understand the data underlying each study because the summaries of the study are not necessarily supported by the data. I asked a neuroscientist friend of mine if that assessment was true and she confirmed it. It turns out that in our imperfect world, personal bias, personal allegiances, integrity, and the corporation or agency funding the study all compete for the appropriate wording of the study summary.
There are many cases of scientists losing their funding and even being discredited because their research did not support the hypothesis of the funding organization or conflicted with currently accepted norms. Many of the researchers speaking out against this bias can only afford to do so because they have retired from their positions and are no longer dependent on the pharmaceutical or industrial food industry.
And what should we think of our physicians when they advise us to lower the saturated fats in our diet? First of all, I am certain that most of the medical doctors that I have consulted have had my best interests at heart. They probably had some nutrition training in medical school, but it was of the USDA variety – a conglomeration of special interests. In medical school they certainly don’t have time to play devil’s advocate and search out alternative opinions and they need to go with the flow to succeed. Our caring general practitioners need to have a really wide breadth of knowledge and it’s just not reasonable to expect them to examine the data behind major studies. This is why we need to take responsibility and be as knowledgeable as possible about our own health.
So how can we laypeople ever believe any research that is published, as we do not have the training or time to delve into the guts of a study? My approach has been to read as much as I can, but I seem to always find myself on the wrong side of Government policy these days. Those readers who have a scientific or medical background doubtless will find flaws with what I’ve presented here, but I believe that it is better for me to do my own research and align myself with organizations I trust rather than just accepting recommendations from my Government and organizations that receive money from big business.
I have come to trust the Weston A. Price Foundation and the research it performs primarily because I have studied their principles, put them into practice, and they worked for me. However, my readers have no need to believe me. I hope those of you who are skeptical will do research on your own and come to your own conclusions.
References:
“A Brief History of USDA Food Guides.” USDA Center for Nutrition (n.d.): n. pag. June 2011. Web. <http://www.choosemyplate.gov/food-groups/downloads/MyPlate/ABriefHistoryOfUSDAFoodGuides.pdf>.
Enig, Mary G., and Sally Fallon. Eat Fat, Lose Fat: Lose Weight and Feel Great with Three Delicious, Science-based Coconut Diets. New York: Hudson Street, 2005. Print.
Enig, Mary G., and Sally Fallon. “The Oiling of America.” Seminar on Healthy Tradional Diets. Maryland, Brandywine. 21 Feb. 2015. Weston A Price. Web. 28 Mar. 2015. <http://www.westonaprice.org/>.
“Framingham Heart Study.” Framingham Heart Study. N.p., n.d. Web. 28 Mar. 2015. <http://www.framinghamheartstudy.org/>.
Minger, Denise Death By Food Pyramid. Malibu, CA: Primal Blueprint Publishing, 2013. Print
“Business Insider.” Business Insider RSS. 24 Jun. 2012. < http://www.businessinsider.com/leading-causes-of-death-from-1900-2010-2012-6?op=1/>
Taubes, Gary. “The Soft Science of Dietary Fat.” Science 291 (2001): n. pag. Web. < http://garytaubes.com/wp-content/uploads/2011/08/Science-The-soft-science-of-dietary-fat-21.pdf>


Good article. These questions are important. “So if we suppose that it’s not saturated fat that causes heart disease, what could it be? Could one cause possibly be the rise in industrial oils? Or perhaps the increase in sugar usage? Or even some factor that all these studies have not identified?”
For what it’s worth, I’d say heart disease arises when mineral intake is low and/or out of balance and when inflammation is induced through excessive linoleic acid added sugars intake. Both added sugars and separated fats dilute mineral intake. However, only linoleic acid induces inflammation.
Suggested reading:
https://www.t-nation.com/diet-fat-loss/fat-that-makes-you-fat
buff.ly/1Cx4x2q
David, very interesting link. I didn’t know about linoleic acid although I had heard that the manufactured vegetable oils like corn and especially soy and canola, because of their GMO content cause inflammation. I cook with coconut oil, beef tallow, or lard from pastured animals which are not fed soy. The article claims that sugar does not cause inflammation which surprises me.